How Steady Can Wind Power Blow?
This is part 2 of a series looking at the economic trends of new energy technologies. Part 1 looked at how cheap solar can get (very cheap indeed). Part 3 looks at how cheap energy storage can get (pretty darn cheap). Part 4 looks at how far renewables can go (pretty darn far). Part 5 looks at how cheap electric vehicles can get, and how they’ll disrupt oil.
NREL recently released data showing that next-generation wind turbines could reach an incredible capacity factor of 60% over 2 million square kilometers of the US, or enough to provide roughly 10x as much electricity as the US uses. Trends suggest this will occur by roughly 2025. If true, this would be a game-changer in wind power, as I explain below.

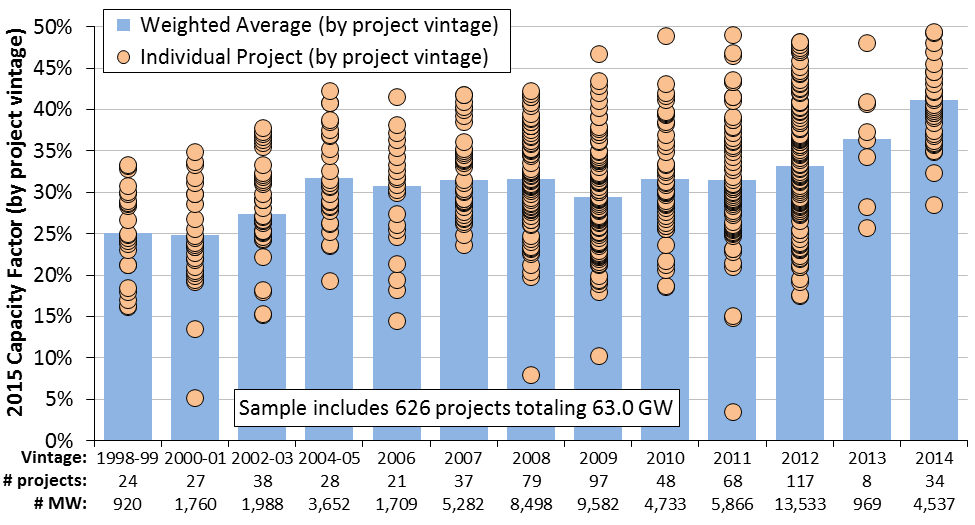
And, historically, the capacity factor of new wind power is rising roughly 1% per year. The average capacity factor of new turbines installed in 2014 was 40%. The best were at 50%. If this trend continues, the best sites will be reaching 60% capacity factors by 2024.
Wind power is the cheapest new electricity available in the United States. But, until recently, it has neither been reliable nor available close to the areas it’s needed. Both of those factors may be changing.
Below I’ll go over:
- The low and declining cost of wind electricity.
- Why grid transmission is vital for the lowest cost wind power.
- The impact of higher capacity factor and less intermittent wind.
Wind is the Cheapest Electricity in the US, and Getting Cheaper
In 2014, the average cost of Power Purchase Agreements for new wind power in the US was around 2.35 cents per kwh, the lowest it has ever been. In the windiest parts of the great plains, prices are as low as 2 cents per kwh.

The above graph from the NREL 2014 Wind Technologies Market Report uses subsidized numbers. Even after removing the effects of the major federal subsidy, the Wind Production Tax Credit, new wind power in the US costs an average of 4 cents per kwh or less.
That 4 cents per kwh is substantially below the 7 cents per kwh or more that new natural gas electricity costs.
Wind power is likely to continue getting cheaper, though that is not as certain as it is for solar. Most of the increase in 2009 and 2010 of wind power was due to the rising prices of steel, copper, and other materials that go into wind turbines. But over a long timeframe, the price of new wind power has declined (according to IEA analysis) at an average rate of somewhere between 9 and 19% per doubling of scale of the wind industry. (pdf link)
Bloomberg New Energy Finance finds a learning rate of roughly 14% over a 28 year span, right in the middle of IEA’s estimates. (While BNEF’s data in this graph ends in 2012, costs have dropped more rapidly than usual since then.)

If we extend this trend of a 14% cost reduction per doubling forward, we get the following price projections for the US.

All the usual caveats apply: This is a forward projection based on a historical rate of progress. Price trends can and do end. And wind will face significant obstacles as penetration rises above ~30% or so.
That said, the trendlines suggest that, by the time wind supplies 20% of US electricity, the unsubsidized cost of wind power at the best sites could be around 3 cents per kwh, and at more typical sites they could be around 4.5 cents per kwh.
Wind is cheap, and will (probably) keep getting cheaper.
So why isn’t there even more of it deployed today?
Getting Wind Power Where It’s Needed
There are two substantial barriers to wind power penetration in the US. The first is transmission.
Most wind projects that have been built to date are located near the area where the energy will be used, not more than few hundred miles away. Over the last decade, new regional transmission lines have been built in Texas, California, and the Midwest to transport wind energy over those short ranges.
However, the windiest parts of the United States (and of other nations) tend to be far away from population centers where electricity is needed. For instance, compare the two maps below. The first shows wind speeds in the US. The second shows the US from space, illustrating (roughly) where electricity is being used.
Wind speeds (NREL):

US cities (NASA Earth Observatory):

The fastest on-land wind speeds (and thus the cheapest and most reliable wind power) run largely in a north-south corridor through the Great Plains and western Texas. Electricity consumption, though, clusters in a broad swath of the eastern third of the United States and a narrow strip along the US west coast.
The highest density of grid transmission lines is similarly in the eastern third of the US and the US west coast and southwest, as pictured below in this map of the grid from 2009. (You can see more at NPR’s excellent, if slightly outdated, interactive power grid map.)

Thus, one key step to unlocking wind as a low-cost resource is continuing to build new transmission, particularly from the less-populated but high-wind interior to population centers east and west.
Transmission costs money, but less than many believe. The cost of high voltage DC (HVDC) transmission lines is roughly 1 cents per kwh for 500 miles, or 1.5 cents per kwh for 1,000 miles transmitted. Over 1,000 miles, an HVDC line may lose 5% or so of the electricity it transmits.
![]()
The continental US is roughly 2,600 miles from east to west. Almost every population center is within 1,000 miles (or far less) of an area with top-notch wind resources. And most are within a few hundred miles of an area with good, if not best-in-class, winds.
HVDC lines are not common in the US, however. Compare the map of HVDC lines in China to that of HVDC lines in the US.

HVDC appears to be going through a resurgence in the US. Transmission-line builder Clean Line, for instance, has plans for ~20GW of long distance HVDC transmission lines to bring great plains wind power to areas where it’s needed. The first of these is targeted for completion in 2020. (More at UBS.)
![]()
Realistically, the US may need 10x this much in new long-range transmission to unlock the highest value winds in the country. The challenge is not so much cost (which, we can see above, still places wind prices lower than fossil fuel electricity prices), but rather regulatory approval, right-of-way, and overcoming NIMBY.
Short story: If we want the cheapest possible wind power, we need to continue to build out grid transmission.
Making Wind Reliable
The second limitation on wind power has been when the wind blows, and when it doesn’t.
Wind power is intermittent. The wind doesn’t always blow fast enough for wind turbines to produce power. In the US, the capacity factor of the current fleet of wind turbines is around 33%. That is to say, on average across the year, a wind turbine that is capable of generating a MW of power will actually produce an average of around 0.33 MW. At some hours it will operate at peak output. At other hours it will operate at a fraction of its maximum output. And at yet other hours, it won’t be generating any electricity at all.
That intermittence creates additional cost for utilities, who have to find some way to back up wind power for those times when the wind isn’t blowing.
What’s just as important is the times and months that wind provides energy.
Today, peak electricity demand in the US happens during the afternoons and early evenings. Electricity demand in the US is higher in summer months than in winter months. (Note that this pattern differs in Europe, where energy-intensive air-conditioning is less common than the US.)
Wind power patterns are nearly the opposite of US electricity demand patterns. Winds tend to max out overnight and in winter months.
The combination of low capacity factor and winds that blow primarily during lower-demand hours means that wind is often slightly less valuable than its price would indicate.
What’s more, wind’s intermittence in the US may place limits on what fraction of US electricity could come from wind. A (very rough) rule of thumb is that, without storage or integration over a large area, the maximum percentage of electricity that could come from a variable source like wind power is equal to its capacity factor. Indeed, as a resource like wind starts to provide an amount of electricity even close to its capacity factor, it tends to flip the supply/demand of the market, increasing supply, and thus lowering the prices the market is willing to pay for new electricity. It eats its own lunch, as described in a well-worth-reading piece on the limitations of renewables, by Jesse Jenkins and Alex Trembath.
There are a variety of caveats to this rule of thumb, in both encouraging and discouraging directions, which I’ll return to in a later post. And there are a number of reasons to believe the limits are substantially beyond what Jesse and Alex describe in their piece. I’ll look specifically at energy storage in my next post, and come back to the larger issue of how far renewables can penetrate sometime after that.
For now: if wind capacity factors were closer to 100%, the problems above would largely disappear, and wind with its current prices would be nearly unbeatable. We’ll likely never have wind at 100% or even 90%, but the closer wind can get to 100% capacity factor, up from its current level of 33% in the US, the more powerful it becomes.
That’s what makes this NREL report so encouraging. The average new wind turbine in the US is 80 meters tall at its hub. NREL looks at what capacity factors could be reached with 110 meter tall and 140 meter tall wind turbines.
That’s consistent with other data showing that every year, the capacity factor of new wind turbines deployed in the US goes up by about 1%. Wind turbines deployed in 2014, for instance, averaged 40% capacity factor (with the best reaching 50%), which is up 15 points from 2000.
NREL’s future-looking chart, below, looks at how high this could go. It shows cumulative area of the contiguous US (along the Y axis) that could reach ever-higher capacity factors (X axis). For context, the contiguous US has a land area of roughly 7.6 million square kilometers.
The different colored lines are different technologies. The black line is 80-meter tall wind turbines that are common today. The red line is 110-meter tall wind turbines that are commercially available today, and which are slightly below the average height of new turbines in Europe, but which are not yet common in the US. And the blue line is 140-meter tall wind turbines. Turbines of that size are being installed in Europe, but not yet in the US.

With 2008 technology (the black line), the line hits zero right around 50% capacity factor. Virtually no part of the US can provide wind power with 50% capacity factor with 80-meter tall turbines.
With newer 110-meter tall turbines, however, nearly 2 million square kilometers of land, or or 26% of the contiguous US, can support wind turbines with capacity factors of 50% or higher.
With 140-meter tall turbines (similar to those already in use in Europe) NREL projects that perhaps 1.8 million square kilometers could host 60% capacity factor wind. That is a near doubling of capacity factor of wind turbines from today. Put another way, it’s wind power that is roughly twice as reliable as the average wind power in the US today.
That, in turn, would lower the cost of backups to the wind. It would raise the physical limits of how much wind power could be integrated into the grid, even without storage. It would spread out and dilute the ‘eat its own lunch’ phenomena whereby renewable resources lower the market price at the hours that they generate. Wind at 60% capacity factor would spread out its delivered electricity over roughly twice as many hours 33% capacity factor, thus reducing the rate at which the prices it could fetch declined. And, most likely, more of the electricity delivered by wind would come at times of high electricity demand, raising the prices wind could fetch via another mechanism.
In short, wind at 60% capacity factor, even at the same price per kwh of today, would be tremendously more valuable than it is now, with fewer limits to how much of it we could use. And we’re on trend for the best sites to achieve that by 2025.
How much wind-generated electricity could be provided on 1.8 million square kilometers? In the US, an average wind farm, as of 2009, produced around 3 W per square meter of all directly and indirectly affected area. (See Land Use Requirements of Modern Wind Power in the US (pdf)). So 1.8 million kilometers (even ignoring the potentially higher energy output of turbines higher in the air) would roughly 5.4 trillion watts, or 5.4 TW.
By contrast, the average US electricity consumption in 2014 was around 0.5 TW.
So, if NREL is correct, sufficient land area exists in the US to provide 60% capacity factor wind power to meet US electricity needs 10x over.
To be clear, for a variety of reasons, wind, like solar, will never be 100% of US electricity production. But the headroom appears to be there.
Would larger wind turbines be more expensive? Per wind turbine, they certainly would be. But each will also produce more electricity, more reliably. 140-meter wind turbines in use in Europe generate 5 to 7 MW of power, vs the 2 MW common for 80-meter wind turbines.
As a general rule of thumb, wind turbines produce electricity equal to the area their blades sweep through. And area is equal to the square of blade length. That means that doubling the tower height and blade length quadruples the area the blades spin through, and generates 4x as much energy. Partially as a result, wind prices per kwh have dropped, even as (or in part because) wind turbines have grown taller.

We should expect that taller wind turbines will continue this trend. More electricity per dollar, along with higher capacity factors.
Building 140-Meter Tall Wind Turbines
NREL’s projection of the capacity factors of future wind turbines is, of course, just a projection. NREL has an excellent track record, yet we won’t truly know the achievable capacity factors for 140 meter wind turbines until we have a number built in the US.
Actually building them is quite a challenge, however. Wind turbine components are built in factories and then transported to the site. But as wind turbines have grown larger, transportation has hit the limits of what can be moved by road.
Consider the following images from DOE’s Wind Visions report, showing the challenges of moving a segment of a wind turbine tower (first image) and of moving a single blade of a wind turbine (second image).
![]()
![]()
These images depict the challenges of transporting current wind turbine components. To move pieces of 140-meter turbines (more than 500 feet tall), new steps are needed.
The new frontier is to assemble more of the wind turbine at the site, using parts that fit in ordinary semi-trailer or flat-bed truck cargos. That’s the approach used by GE’s Space Frame wind towers, which use a scaffolding-like approach to wind turbine construction. And it’s also the approach used by a number of companies working on wind turbine blades that can be shipped in pieces and assembled into full-length blades on site.
None of this is impossible. Germany’s wind industry already averages 120 meters for new wind turbines, with some as tall as 140 meters. But deploying these in the US will require innovation.
Whole articles can and have been written on these frontiers in wind turbine assembly. For an excellent overview, read John Timmer’s piece on the future of wind power at Ars Technica. Or, for a more technical view, read DOE’s Wind Visions Report.
In Summary
Technical challenges remain. But if they can be surmounted, wind power appears to be headed for a new frontier in reliability. Wind is already the cheapest source of electricity in the United States, and could, with these advances, provide half or more of the US’s electricity consumption.
—-
If you enjoyed this post, you might enjoy my book on innovating in energy, food, water, climate, and more: The Infinite Resource: The Power of Ideas on a Finite Planet
