What’s the EROI of Solar?
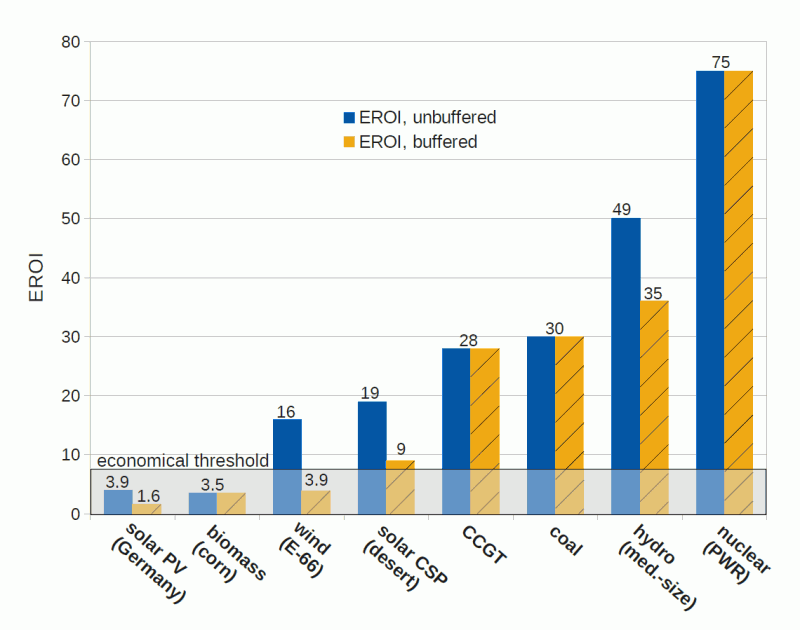
There’s a graph making rounds lately showing the comparative EROIs of different electricity production methods. (EROI is Energy Return On Investment – how much energy we get back if we spend 1 unit of energy. For solar this means – how much more energy does a solar panel generate in its lifetime than is used to create it?)
While the EROI graph may raise questions about the scalability of solar and wind energy for supporting an industrialized society, it is crucial to consider the broader context and real-world applications of these renewable sources. While large-scale industrial energy production certainly requires careful planning and integration, the role of solar energy in day-to-day life extends beyond industrial applications. The commercial and residential solar panels offer individuals and businesses the opportunity to generate their own clean energy, reducing their reliance on traditional electricity grids and decreasing their carbon footprint. By embracing solar energy on a smaller scale, communities can contribute to a more decentralized and sustainable energy landscape while enjoying the benefits of reduced energy costs and increased energy independence. While the scalability of solar energy for large-scale industrial use may present challenges, its role in powering everyday life and fostering local sustainability should not be overlooked.
This EROI graph that is making the rounds is being used to claim that solar and wind can’t support an industrialized society like ours.
But its numbers are wildly different from the estimates produced by other peer-reviewed literature, and suffers from some rather extreme assumptions, as I’ll show.
Here’s the graph.
This graph is taken from Weißbach et al, Energy intensities, EROIs, and energy payback times of electricity generating power plants (pdf link). That paper finds an EROI of 4 for solar and 16 for wind, without storage, or 1.6 and 3.9, respectively, with storage. That is to say, it finds that for every unit of energy used to build solar panels, society ultimately gets back 4 units of energy. Solar panels, according to Weißbach, generate four times as much energy over their lifetimes as it takes to manufacture them.
Unfortunately, Weißbach also claims that an EROI of 7 is required to support a society like Europe. I find a number that high implausible for a number of reasons, but won’t address it here.
I’ll let others comment on the wind numbers. For solar, which I know better, this paper is an outlier. Looking at the bulk of the research, it’s more likely that solar panels, over their lifetime, generate 10-15 times as much energy as it takes to produce them and their associated hardware. That number may be as high as 25. And it’s rising over time.
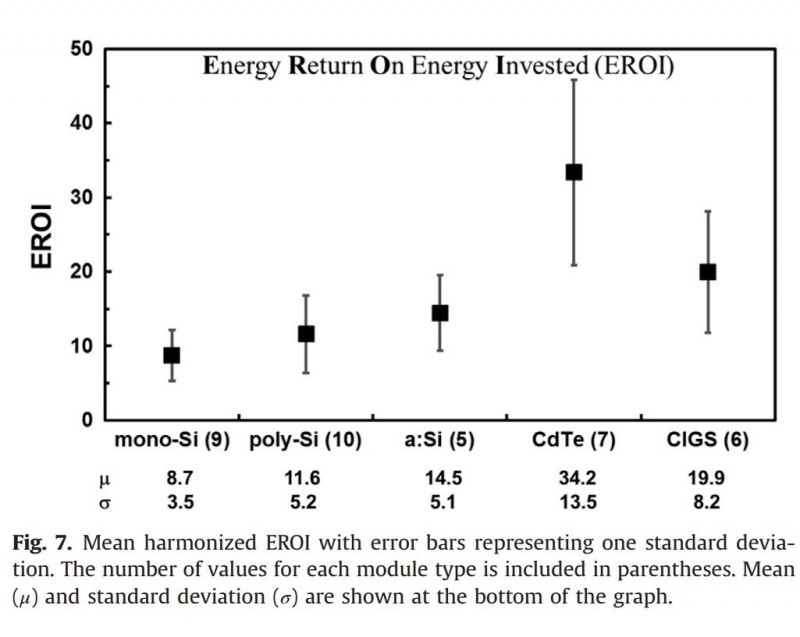
The most comprehensive review of solar EROI to date is Bhandari et al Energy payback time (EPBT) and energy return on energy invested (EROI) of solar photovoltaic systems: A systematic review and meta-analysis
Bhandari looked at 232 papers on solar EROI from 2000-2013. They found that for poly-silicon (the predominant solar technology today, found in the second column below), the mean estimate of EROI was 11.6. That EROI includes the Balance of System components (the inverter, the framing, etc..) For thin film solar systems (the right two columns), they found an EROI that was much higher, but we’ll ignore that for now.
Note that for the second column, poly-Si, the EROI estimates range from around 6 to 16. This is, in part, because the EROI of solar has been rising, as the amount of energy required to create solar panels has dropped. Thus, the lower estimates of EROI come predominantly from older studies. The higher estimates come predominantly from more up-to-date studies.
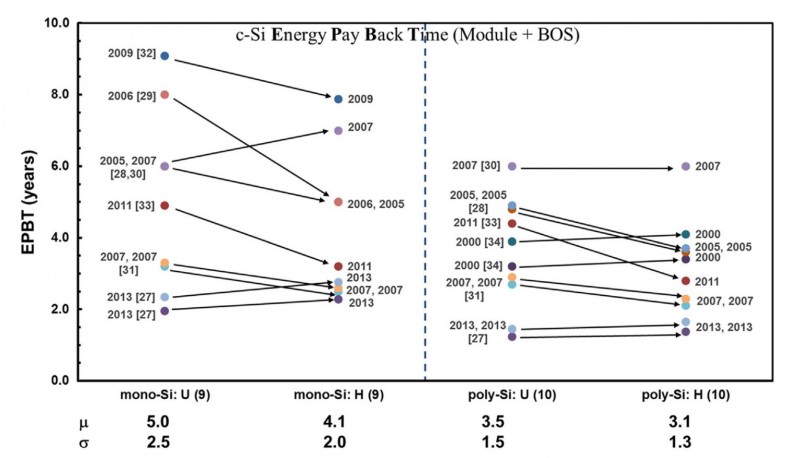
We can see this in estimates of the “energy payback time” of solar (again, including Balance of System components). The energy payback time is the amount of time the system must generate electricity in order to ‘pay back’ the energy used to create it. Estimates of the energy payback time of poly-si solar panels (the right half of the graph below) generally shrink with later studies, as more efficient solar panels manufactured with less energy come into play.
The mean energy payback time found is 3.1 years (last column, above). But if we look at just the studies from after 2010, we’d find a mean of around 2 years, or 1.5x better EROI than the overall data set. And the latest study, from 2013, finds an energy payback time of just 1.2 years.
That is to say, the EROI of solar panels being made in 2013 is quite a bit higher than of solar panels made in 2000. That should be obvious – increasing efficiency and lower energy costs per watt make it so. If we used only the estimates from 2010 on, we’d find an EROI for poly-Si solar of around 15. If we used only the 2013 estimate, we’d find an EROI of around 25.
So how does Weißbach et al find a number that is so radically different? There are three things that I see immediately:
1. Weißbach assumes that half of all solar power is thrown away. The article uses an ‘overproduction’ factor of 2x, which seems fairly arbitrary and doesn’t at all reflect current practice or current deployment. There may be a day in the future when we overbuild solar and throw away some of the energy, but if so, it will come after solar panels are more efficient and less energy intensive to make.
2. Weißbach uses an outdated estimate of silicon use and energy cost. Weißbach’s citation on the silicon input to solar panels (which dominates) is from 2005, a decade ago. Grams of silicon per watt of solar have dropped since then, as has the energy intensity of creating silicon wafers.
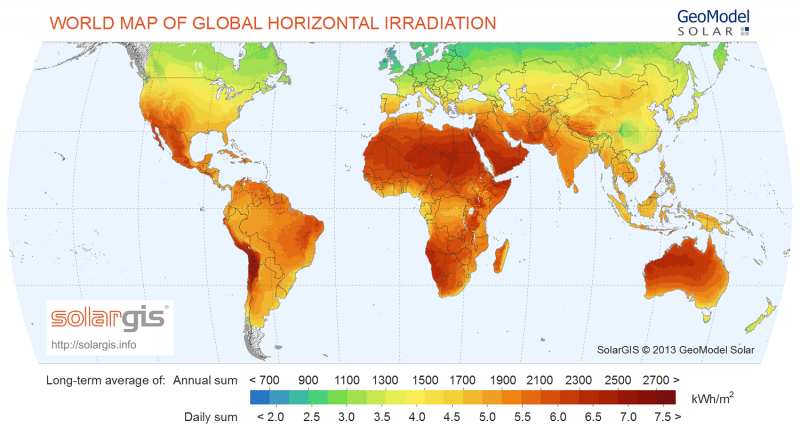
3. Weißbach assumes Germany, while Bhandari assumes a sunny place. The Weißbach paper assumes an amount of sunlight that is typical for Germany. That makes some sense. Germany has, until now, been the solar capital of the world. But that is no longer the case. Solar installation is now happening first and foremost in China, then the US. In the longterm, we need it to happen in India. The average sunlight in those areas is much closer to the assumptions in Bhandari (1700 kwh / m^2 per year) than the very low-sunlight model used in Weißbach. (Remember: Germany is roughly as sunny as Canada, as you can see in the map below. Almost the entire world gets more sun than Germany, thus making costs lower worldwide and EROI higher.)
4. (Bonus) Weißbach assumes 10 days of storage. The Weißbach paper and graph also gives a second, “buffered”, number for EROI. This is the number assuming storage. Here, Weißbach uses an estimate that solar PV needs to store energy for 10 days. This is also fairly implausible. It maps to a world where renewables are 100% of energy sources. Yet that world (which we’ll never see) would be one where solar’s EROI had already plunged substantially due to lower energy costs and rising efficiency. More plausibly, in the next decade or two, most stored energy produced by PV will be consumed within a matter of hours, shifting solar’s availability from middle-of the day to the early evening to meet the post-sunset portion of the peak.
In summary: The Weißbach paper is, with respect to solar, an outlier. A more realistic estimate of poly-Si solar EROI, today, is somewhere above 10, and probably above 15. And it’s rising. Solar panels generate many times more energy over their lifetimes than is used to construct them and their associated hardware.


